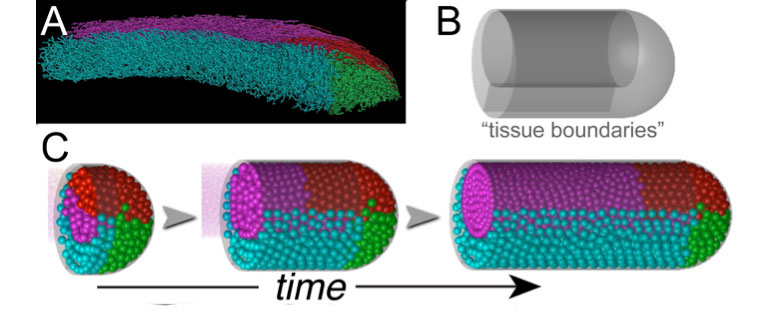
Computational studies of the growing Zebrafish tailbud.
(A) Lateral view of cell track data from a wild-type embryo.
(B) Tissue boundaries shown for a simplified tailbud geometry in a 3D model.
(C) The flow of cells introduced in the central region (magena) as the tailbud is growing. Different colors indicate different regions of the tailbud.