
Project Overview
We will develop a discrete element simulation that models the spatiotemporal dynamics of the melanoma tumor microenvironment and is calibrated to in vivo confocal imaging of melanoma tumors. Using image analysis, we will identify cell types, shapes, and locations in tumor tissue. We will investigate how cells are organized within the tumor and whether there are strong spatial correlations among different cell types. We will simulate virtual tumors in two and three spatial dimensions, cross-validate our results with tumor growth in vivo, and use the results of the simulations predict tumor growth and metastasis.
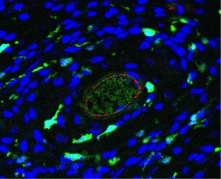
Image above: Figure 1. High-resolution confocal microscope image of a 3.12 µm section of a murine melanoma tumor. The nuclei, tumor-associated macrophages, and vasculature are stained blue, green, and red, respectively.
Experimental Studies: Melanoma cancer cells are injected into mice to form melanoma tumors. The tumors are removed from the mouse at various time points of development and preserved in paraffin wax. The tumor is sectioned into thin slices and imaged using high-resolution confocal microscopy. The tumor is stained to highlight distinct cell types, including nuclei, tumor-associated macrophages, and vasculature as shown in Fig. 1.
Image Analysis: We have developed numerical methods to segment and identify melanoma and immune cells and vasculature from the images. (See Fig. 2.) We first identify the cell boundaries and then compute the geometric center, area, and perimeter of each cell.
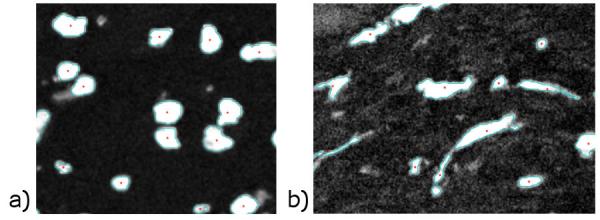
Image above: Figure 2: Results from the numerical cell segmentation algorithm that identifies (a) nuclei and (b) tumor-associated macrophages in melanoma tumor tissue. The boundaries and geometric centers of each cell are indicated by cyan lines and red stars, respectively.
We performed preliminary analyses of confocal images of melanoma tumors from two groups of mice. One group was the control, and the other group was given a tumor-associated macrophage inhibitor. For a given section size, we found that the total number of cells was the same for the two groups, while there was a decrease in the number of tumor-associated macrophages in the treated group (Fig. 3). We also found that in the treated tissue the tumor-associated macrophages moved at higher speeds through the tissue and were more circular compared to the control tissue. In Fig. 4, we show the distributions P(S) of the shape parameter S=4πA/P2, where A and P are the cell area and perimeter, for tumor-associated macrophages in the control and treated tissue. S=1 indicates a circular shape, while S≈0 is highly non-circular. Fig. 4 shows that the macrophages in the treated group are more circular than the control group. In future studies, we will study spatial correlations and neighbor statistics for cancer and immune cells in melanoma tumors.
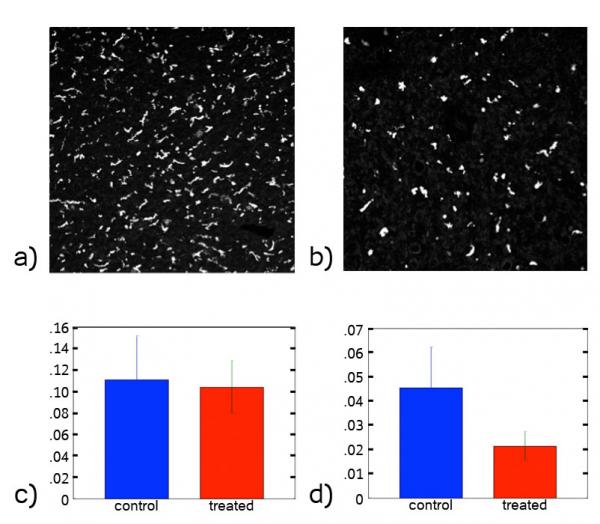
Image above: Figure 3: Confocal Images of tumor-associated macrophages in melanoma tumor tissue from two groups of mice: (a) a control group and (b) a group treated with a tumor-associated macrophage inhibitor. Number density of (c) nuclei and (d) tumor-associated macrophages for the control group and inhibited group.
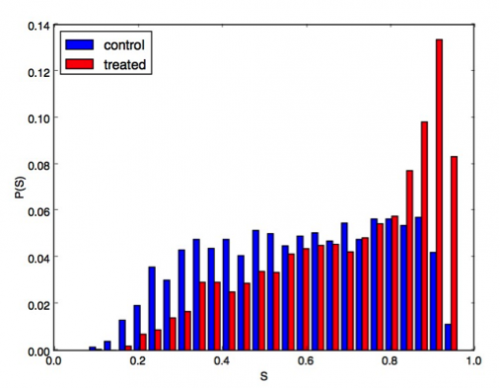
Image above: Figure 4. Probability distribution P(S) of the shape parameter S=4πA/P2, where A and P are the area and perimeter for cells in two melanoma tumor samples: a control (blue) and another treated with a macrophage inhibitor (red). S=1 indicates circular shapes.